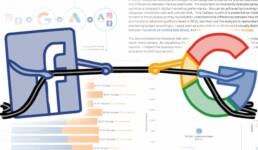
In 2020, I analyzed Facebook and Google Ad campaign performance for a small business to visualize the differences between the two platforms. It’s important to constantly evaluate campaigns to optimize a company’s digital marketing performance - this can be achieved by tracking metrics like ad campaign conversion rate and cost per click. This Tableau is part of a presentation made for the owners of the business so they could better understand the differences between how their Google and Facebook advertising efforts fared in 2019, and then use the analysis to reallocate their marketing budget accordingly. I used color as a pre-attentive attribute to visually distinguish between Facebook ad related data (blue), and Google Adwords related data (orange).
ClientConfidentialServicesDigital Media Analysis & VisualizationYear2020Linkpublic.tableau.com?:language=en-US&:display_count=n&:origin=viz_share_link